Bike Sales Data Analysis & Business Insights (SQL and Power BI)

Introduction
This project aims to analyze sales data over multiple years to identify key trends, customer behavior, product performance, and regional sales distribution. By leveraging structured business data, we can generate insights that support decision-making, improve operational efficiency, and enhance overall business strategy.
Dataset Overview
The dataset consists of 10 interrelated tables that provide a comprehensive view of sales transactions, customer demographics, product information, and regional sales performance. Below is a breakdown of the key tables:
- Calendar – Contains date-related information, useful for analyzing sales trends over time.
- Product – Stores details of individual products, including names, categories, prices, and descriptions.
- Product Categories – Defines high-level product classifications.
- Product Subcategories – Provides more granular product classification under each category.
- Customers – Contains customer demographics such as age, income, education level, and marital status.
- Returns – Tracks product returns, including return dates, quantities, and affected territories.
- Territory – Defines geographical sales regions.
- Sales2020, Sales2021, Sales2022 – Stores sales transaction records for each respective year, including order details, product sales, and customer purchases. Milestones
Import Data from GitHub
Download the dataset from GitHub, Sales Data Analysis
Transfer dataset to SQL Server using “SQL Server Import and Export Wizard”

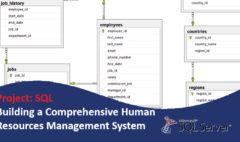
Model View (Database Diagram) – Snowflake Schema

End Clients Requirements
1. How many unique products are listed in the dataset?
SELECT COUNT(DISTINCT ProductKey) AS UniqueProductCount
FROM Product;
2. What is the most common marital status among customers?
SELECT MaritalStatus, COUNT(*) AS Count
FROM Customers
GROUP BY MaritalStatus
ORDER BY Count DESC;
3. What is the average product price across all products?
SELECT AVG(ProductPrice) AS AverageProductPrice
FROM Product;
4. Which product had the highest total sales quantity in 2022?
SELECT TOP 1 P.ProductName, SUM(S.OrderQuantity) AS TotalQuantity
FROM Sales2022 S
JOIN Product P ON S.ProductKey = P.ProductKey
GROUP BY P.ProductName
ORDER BY TotalQuantity DESC;
5. What percentage of customers own a home (HomeOwner = Y)?
SELECT
(COUNT(CASE WHEN HomeOwner = ‘Y’ THEN 1 END) * 100.0 / COUNT(*)) AS HomeOwnerPercentage
FROM Customers;
6. How many returns were recorded for each territory in 2020?
SELECT TerritoryKey, SUM(ReturnQuantity) AS TotalReturns
FROM Returns
WHERE YEAR(ReturnDate) = 2020
GROUP BY TerritoryKey
ORDER BY TotalReturns DESC;
7. What is the trend of total sales across 2020, 2021, and 2022? (Provide insights using total order quantity)
SELECT ‘2020’ AS Year, SUM(OrderQuantity) AS TotalSales FROM Sales2020
UNION ALL
SELECT ‘2021’, SUM(OrderQuantity) FROM Sales2021
UNION ALL
SELECT ‘2022’, SUM(OrderQuantity) FROM Sales2022
ORDER BY Year;
8. Which customer segment (based on income or education level) generates the highest revenue?
SELECT TOP 1 C.EducationLevel, SUM(S.OrderQuantity * P.ProductPrice) AS TotalRevenue
FROM Sales2022 S
JOIN Customers C ON S.CustomerKey = C.CustomerKey
JOIN Product P ON S.ProductKey = P.ProductKey
GROUP BY C.EducationLevel
ORDER BY TotalRevenue DESC;
9. Can we identify any correlation between product returns and product categories or territories?
SELECT PC.ProductSubcategoryKey, T.SalesTerritoryKey, SUM(R.ReturnQuantity) AS TotalReturns
FROM Returns R
JOIN Product P ON R.ProductKey = P.ProductKey
JOIN [Product SubCategories] PC ON P.ProductSubcategoryKey = PC.ProductSubcategoryKey
JOIN Territory T ON R.TerritoryKey = T.SalesTerritoryKey
GROUP BY PC.ProductSubcategoryKey, T.SalesTerritoryKey
ORDER BY TotalReturns DESC;
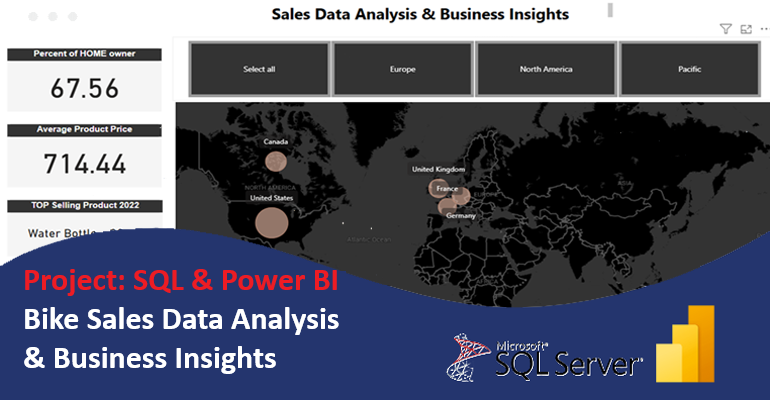
Power BI Dashboard
Power BI does not support multiple SQL statements in a single query inside the Advanced Options query editor. To combine these queries into one structured SQL query, use a CTE approach so that Power BI can return all results in one table.
WITH UniqueProducts AS (
    SELECT COUNT(DISTINCT ProductKey) AS UniqueProductCount FROM Product
),
MaritalStatusCount AS (
    SELECT TOP 1 MaritalStatus, COUNT(*) AS Count
    FROM Customers
    GROUP BY MaritalStatus
    ORDER BY Count DESC
),
AveragePrice AS (
    SELECT CEILING(AVG(ProductPrice) * 10000) / 10000.0 AS AverageProductPrice FROM Product
),
TopProduct2022 AS (
    SELECT TOP 1 P.ProductName, SUM(S.OrderQuantity) AS TotalQuantity
    FROM Sales2022 S
    JOIN Product P ON S.ProductKey = P.ProductKey
    GROUP BY P.ProductName
    ORDER BY TotalQuantity DESC
),
HomeOwnerPercentage AS (
    SELECT (COUNT(CASE WHEN HomeOwner = 'Y' THEN 1 END) * 100.0 / COUNT(*)) AS HomeOwnerPercentage FROM Customers
),
TerritoryReturns AS (
    SELECT TerritoryKey, SUM(ReturnQuantity) AS TotalReturns
    FROM Returns
    WHERE YEAR(ReturnDate) = 2020
    GROUP BY TerritoryKey
),
SalesTrend AS (
    SELECT '2020' AS Year, SUM(OrderQuantity) AS TotalSales FROM Sales2020
    UNION ALL
    SELECT '2021', SUM(OrderQuantity) FROM Sales2021
    UNION ALL
    SELECT '2022', SUM(OrderQuantity) FROM Sales2022
),
TopRevenueSegment AS (
    SELECT TOP 1 C.EducationLevel, SUM(S.OrderQuantity * P.ProductPrice) AS TotalRevenue
    FROM Sales2022 S
    JOIN Customers C ON S.CustomerKey = C.CustomerKey
    JOIN Product P ON S.ProductKey = P.ProductKey
    GROUP BY C.EducationLevel
    ORDER BY TotalRevenue DESC
),
ReturnCorrelation AS (
    SELECT PC.ProductSubcategoryKey, T.SalesTerritoryKey, SUM(R.ReturnQuantity) AS TotalReturns
    FROM Returns R
    JOIN Product P ON R.ProductKey = P.ProductKey
    JOIN [Product SubCategories] PC ON P.ProductSubcategoryKey = PC.ProductSubcategoryKey
    JOIN Territory T ON R.TerritoryKey = T.SalesTerritoryKey
    GROUP BY PC.ProductSubcategoryKey, T.SalesTerritoryKey
)

SELECT
    (SELECT UniqueProductCount FROM UniqueProducts) AS UniqueProducts,
    (SELECT MaritalStatus FROM MaritalStatusCount) AS MostCommonMaritalStatus,
    (SELECT Count FROM MaritalStatusCount) AS MaritalStatusCount,
    (SELECT AverageProductPrice FROM AveragePrice) AS AverageProductPrice,
    (SELECT ProductName FROM TopProduct2022) AS TopSellingProduct2022,
    (SELECT TotalQuantity FROM TopProduct2022) AS TotalQuantitySold,
    (SELECT HomeOwnerPercentage FROM HomeOwnerPercentage) AS HomeOwnerPercentage,
    (SELECT EducationLevel FROM TopRevenueSegment) AS TopRevenueSegment,
    (SELECT TotalRevenue FROM TopRevenueSegment) AS TotalRevenue;
Conclusion
After completing the project with SQL and Power BI, we have successfully integrated and analyzed key business data from the Project Sales dataset. The insights derived from SQL queries and Power BI visualizations have provided a comprehensive understanding of customer demographics, product performance, sales trends, and operational efficiency.
This project has established a strong foundation for data analytics and business intelligence, allowing continuous monitoring, optimization, and strategic growth for the organization. Future enhancements can include predictive analytics, machine learning models, and AI-driven recommendations for even deeper insights.